
Juttle
One query language* to rule them all
*okay, more than just a query language, but KISS
Find all the log lines with status_code 500 in the last day and return the per-hour counts - either from splunk, a file, or elastic.
Plot a 5 minute moving average CPU usage, grouped by host, starting one hour ago and updating every 30 seconds.
Count the access logs for the past day by user_id, join with the static users database to map each user's id to the corresponding company name, then add up the counts by company and display the top 10 in a barchart.
Juttle Engine brings together Juttle, Juttle Service, adapters, Juttle Viewer, Juttle Viz, and Juttle Client Library.
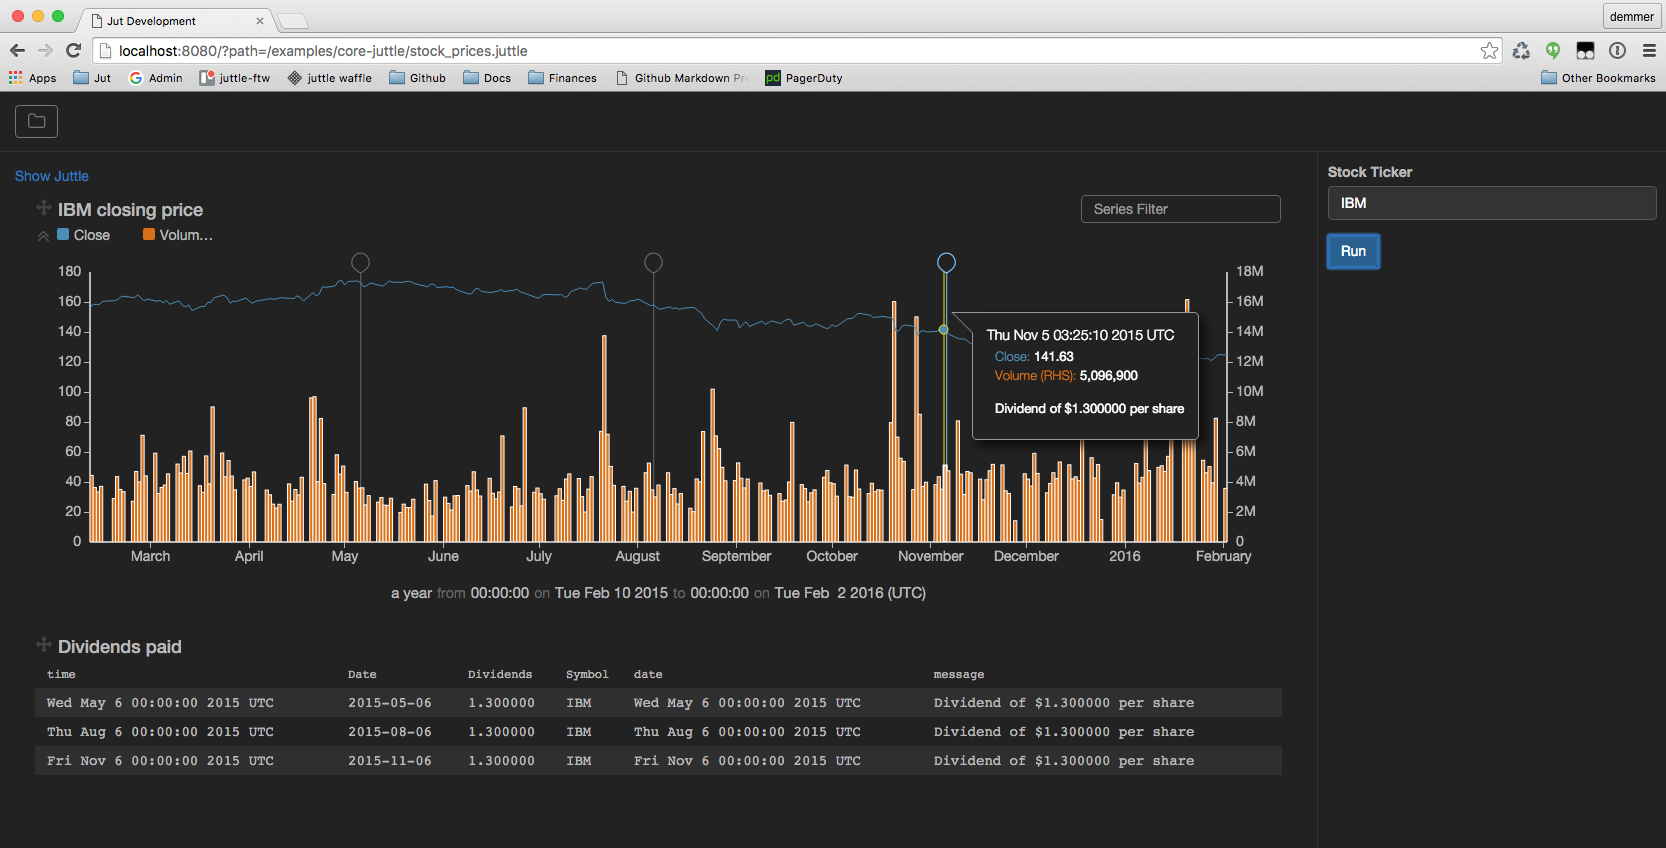
Run juttles stored on your filesystem and see the results right in your browser.
Adapters are juttle's gateway to the world of data stores and services. There are already a bunch to get you started.
Don't see an adapter you need? Write one yourself or file an issue to request a new one.
Juttle Service exposes a REST API to run juttles. Hit it directly, or use Juttle Client Library to make streaming juttles and charts a breeze.
POST /api/v0/jobs HTTP/1.1
Host: localhost:2000
Content-Type: application/json

{
  "bundle": {
    "program": "emit -limit 2 | put v = count() | view table"
  },
  "wait": true
}
{
  "output": {
    "view0": {
      "options": {
        "_jut_time_bounds": []
      },
      "type": "table",
      "data": [
        {
          "type": "points",
          "points":[
            {
              "time": "$date$2016-03-09T18:31:10.047Z",
              "v": 1
            },
            {
              "time": "$date$2016-03-09T18:31:11.047Z",
              "v": 2
            }
          ]
        }
      ]
    }
  },
  "errors": [],
  "warnings":[]
}
Embedded juttle lets you run juttle queries against in-memory data instead of data stores, right in the browser.
const points = [
    {
        time: new Date(1000),
        v: 1
    },
    {
        time: new Date(2000),
        v: 2
    }
];

let juttle = new EmbeddedJuttle('put v2 = v | view table');

juttle.run({
    wait: true,
    points: points
}).then((result) => {
    console.log(JSON.stringify(result, null, 2));
})
.catch((err) => {
    console.log("got an error trying to do runBatch: " + err);
});
{
  "output": {
    "view0": {
      "type": "table",
      "options": {},
      "data": [
        {
          "type": "point",
          "point": {
            "time": "1970-01-01T00:00:01.000Z",
            "v": 1,
            "v2": 1
          }
        },
        {
          "type": "point",
          "point": {
            "time": "1970-01-01T00:00:02.000Z",
            "v": 2,
            "v2": 2
          }
        }
      ]
    }
  },
  "warnings": [],
  "errors": []
}