scatterchart
Plot data points as individual dots across two axes sourced from the data fields; can be faceted.
view scatterchart -o {
   title: string,
   markerSize: n,
   markerOpacity: n,
   duration: duration,
   limit: n,
   valueField: fieldname,
   controlField: fieldname,
   keyField: fieldname,
   timeField: fieldname,
   xScales: {
     primary: {
       label: string,
       tickFormat: d3FormatString,
       minValue: value,
       maxValue: value
     }
   },
   yScales: {
     primary: {
       label: string,
       tickFormat: d3FormatString,
       minValue: value,
       maxValue: value,
       displayOnAxis: 'left|right'
     }
   },
   tooltip: {
     titleField: fieldname,
     controlLabel: string,
     controlFormat: d3FormatString,
     valueLabel: string,
     valueFormat: d3FormatString
   },
   series: [
   {
     name: 'string',
     label: 'string',
     color: 'color'
   },
   {
     name: 'anotherseries',
     ...
   }
   ],
   facet: {
     fields: [field1, ...fieldN],
     width: n,
     height: n
   }
or
view scatterchart -title string
-markerSize n -markerOpacity n -duration duration -limit n
-valueField fieldname -controlField fieldname -keyField fieldname -timeField fieldname
-xScales.primary.label string -xScales.primary.tickFormat d3FormatString -xScales.primary.minValue value -xScales.primary.maxValue value
-yScales.primary.label string -yScales.primary.tickFormat d3FormatString -yScales.primary.minValue value -yScales.primary.maxValue value -yScales.primary.displayOnAxis 'left|right'
-tooltip.titleField fieldname -tooltip.controlLabel string -tooltip.controlFormat d3FormatString -tooltip.valueLabel string -tooltip.valueFormat d3FormatString
-series [{name: 'string', label: 'string', color: 'color'},{name: 'anotherseries', ...}]
  -facet.fields field1, ...fieldN -facet.width n -face.height n
| Parameter | Description | Required? |
|---|---|---|
-title |
The title for the user-visible output, if it has one; the value may be any valid Juttle expression that produces a string | No; defaults to the name field that is present in all metrics points |
-markerSize |
The pixel size of the circle for each point | No; defaults to 6 |
-markerOpacity |
The opacity level of the datapoint marker, a number between 0.1 (10%) and 1 (100%) | No; defaults to 1 |
-duration |
The span of time to display, either in seconds (>=10) or as a Juttle moment literal | No; defaults to 5 minutes when querying live data |
-limit |
The maximum number of total data points to display | No; defaults to the first 1000 to avoid consuming unbounded memory |
-valueField |
The name of the field to use as the source for the numeric values | No; defaults to the value field that is present in all metrics points. If no value field is present, the first numeric field in the stream is used. |
-controlField |
The name of the field to use as the source for the X-axis values | No; defaults to a field called control, if present, otherwise the second numerical field in the stream |
-keyField |
The field containing the name of the series to which each point belongs | Required when series is configured; otherwise Jut looks for unique streams and creates a series for each one. For simple metrics, the key field defaults to the name field that is present in all metrics points |
-timeField |
The field containing the time stamp | No; defaults to the time field |
-xScales.primary.label |
A string to label the X axis | No; defaults to the name of the -controlField |
-xScales.primary.tickFormat |
Customize the unit display for this axis, using the d3 number formatting syntax | No |
-xScales.primary.minValue |
The value at the left end of the X scale | No; the default is automatically derived from your data |
-xScales.primary.maxValue |
The value at the right end of the X scale | No; the default is automatically derived from your data |
-yScales.primary.label |
A string to label the Y axis | No; default is the name of the -valueField |
-yScales.primary.tickFormat |
Customize the unit display for the Y axis, using the d3 number formatting syntax | No |
-yScales.primary.minValue |
The value at the bottom of the Y scale | No; the default is automatically derived from your data |
-yScales.primary.maxValue |
The value at the top of the Y scale | No; the default is automatically derived from your data |
-yScales.primary.displayOnAxis |
Where to display the Y axis; must be exactly one of the following depending on whether your bar chart is oriented vertically or horizontally:
|
No; the default is left |
-tooltip.titleField |
The name of the field containing a string to use as the title for the tooltip | No; defaults to the -keyField |
-tooltip.controlLabel |
A string for the label to display in the tooltip for the -controlField value | No; defaults to the -xScales.primary.label |
-tooltip.controlFormat |
The format for the -tooltip.titleField, using the d3 number formatting syntax |
No; defaults to the -xScales.primary.tickFormat |
-tooltip.valueLabel |
A string for the label to display in the tooltip for the -valueField value | No; defaults to the -yScales.primary.label |
-tooltip.valueFormat |
The format for the -tooltip.valueField, using the d3 number formatting syntax | No; defaults to the -yScales.primary.tickFormat |
-series |
Configure one or more data series individually, using one or more arrays with additional parameters, see below | No |
-facet.fields |
A comma-separated list of the fields on which facets are based | Required to enable faceting; omit this option to disable facets |
-facet.width |
The width configuration for facets, which may be a fluid or fixed width:
|
No; defaults to '1/3' |
-facet.height |
A number larger than 80 defining the fixed pixel height of individual facets | No; the default height is calculated based on the width |
Series Parameters
   -series [
   {
     name : 'seriesname',
     label : 'string',
     color : 'color'
   },
   {
     name : 'someotherseries',
     ...
   }
   ]
| Parameter | Description |
|---|---|
name |
A series name that can be found in the specified -keyField; this parameter is required for any configured series. |
label |
An optional string to override the scale label for this series |
color |
The color to use for this series, specified with any CSS3-supported hex or name value; if not specified, a color is selected from the built-in palette |
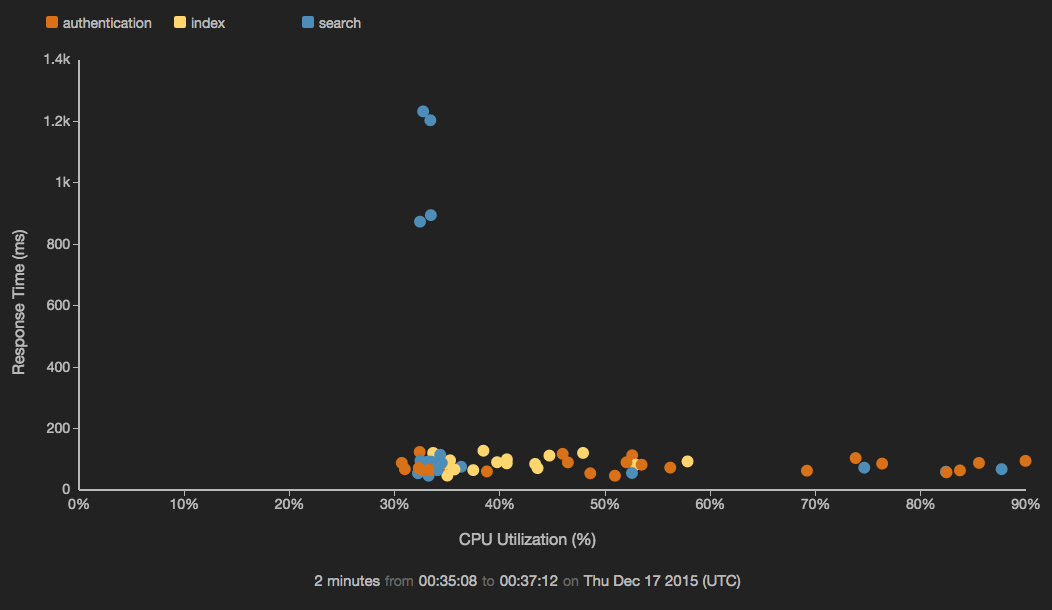
Example: Display a scatterchart showing CPU usage versus response time
(
    read stochastic -source 'srch_cluster' -from :2 minutes ago: name = 'response_ms';
    read stochastic -source 'srch_cluster' -from :2 minutes ago: name = 'cpu'
)
| put *name = value
| join
| keep time, cpu, response_ms, service
| view scatterchart -o {
    valueField: 'response_ms',
    controlField: 'cpu',
    keyField: 'service',
    xScales: {
        primary: {
            label: 'CPU Utilization (%)',
            tickFormat: '%'
        }
    },
    yScales: {
        primary: {
            label: 'Response Time (ms)'
        }
    },
    duration: :5m:
}
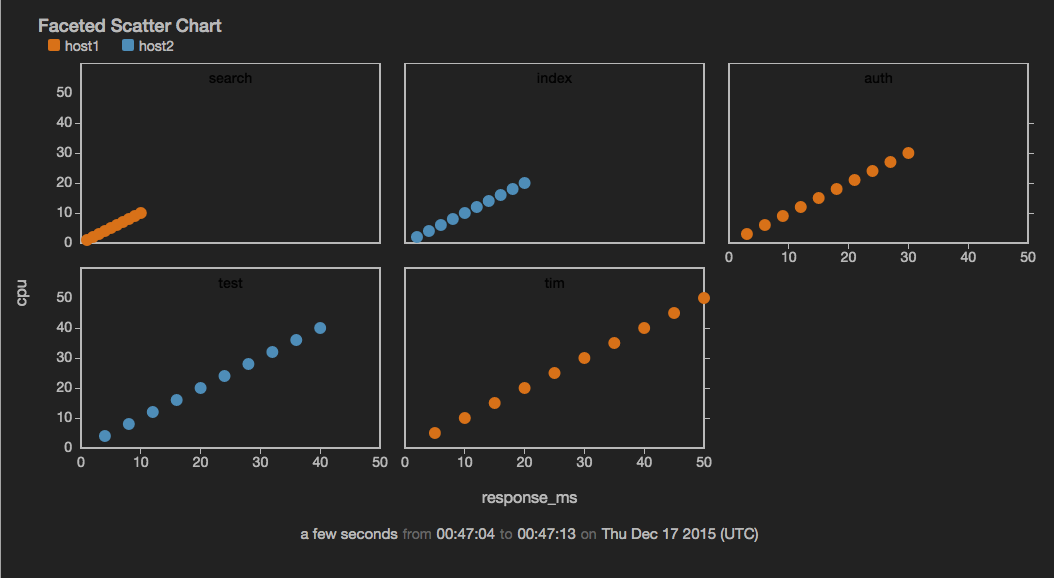
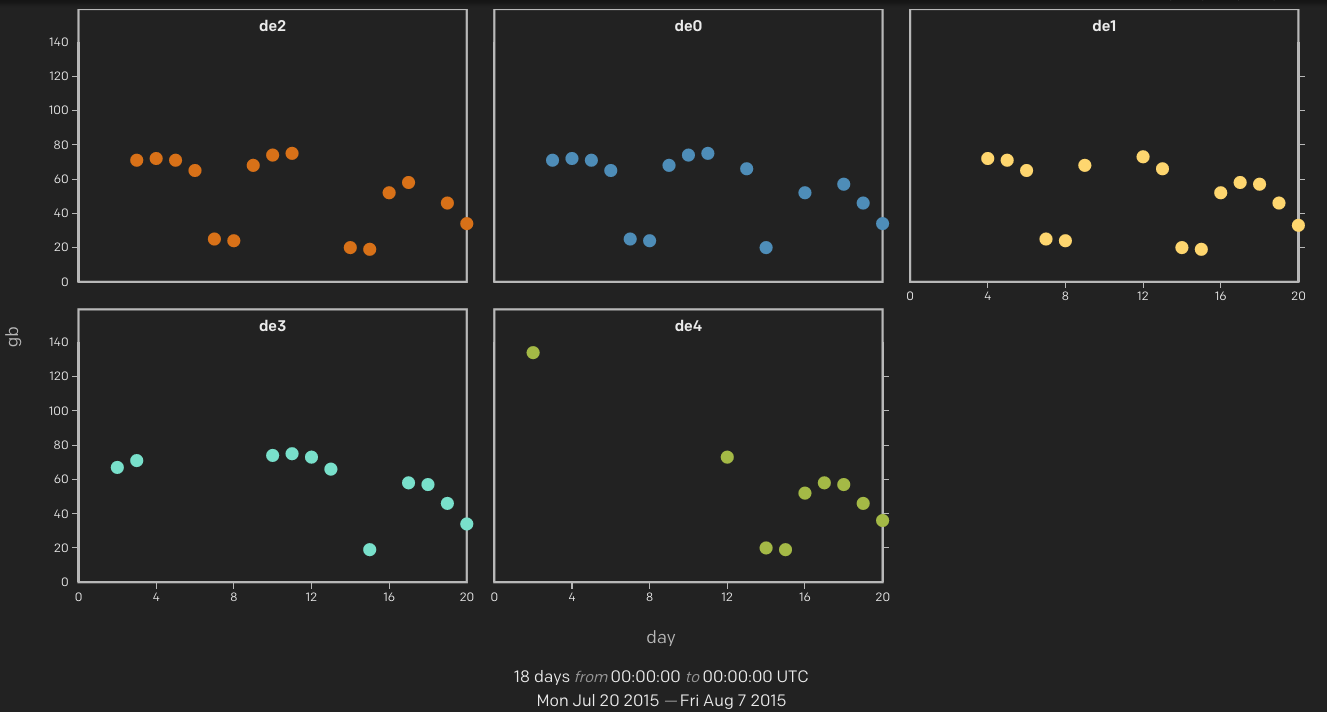
Example: Display a faceted scatterchart
(
emit -limit 10 | put  response_ms = count(), cpu = count(), service = 'search', host = 'host1';
emit -limit 10 | put  response_ms = count()*2, cpu = count()*2, service = 'index', host = 'host2';
emit -limit 10 | put  response_ms = count()*3, cpu = count()*3, service = 'auth', host = 'host1';
emit -limit 10 | put  response_ms = count()*4, cpu = count()*4, service = 'test', host = 'host2';
emit -limit 10 | put  response_ms = count()*5, cpu = count()*5, service = 'tim', host = 'host1';
)
| view scatterchart -o {
  title: 'Faceted Scatter Chart',
  valueField: 'cpu',
  controlField: 'response_ms',
  facet: {
    fields: ['service'],
    width: '1/3',
    height: 150
  },
  duration: :10s:
}