Creating a dual-axis time chart
A time chart can have one Y axis or two. A dual-axis time chart is a multi-series time chart in which some of the series have a different Y scale than the others.
-
In your @timechart, use the
yScales.primary.*andyScales.secondary.*parameters to configure the two Y scales.One must include displayOnAxis: 'right'.
-
Use the
series.yScaleparameter to configure the data series that belong to the secondary Y scale.Since primary is the default value, you only need to specify this parameter for the series that belong to the secondary scale.
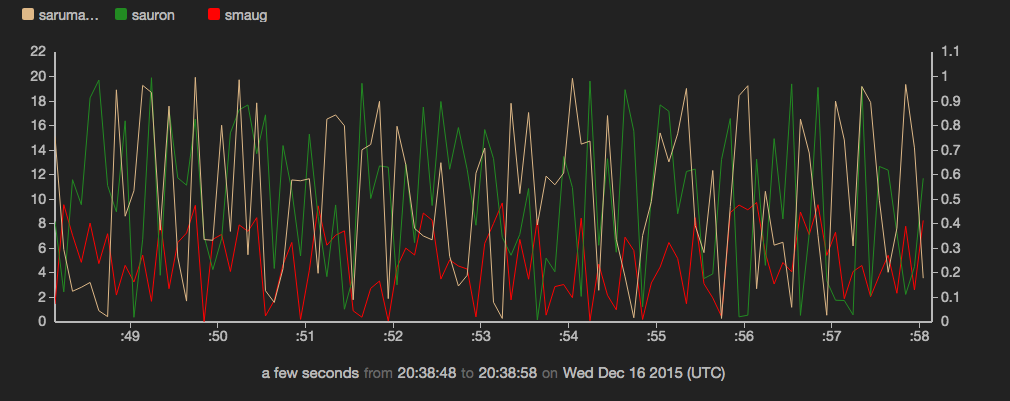
Example: Create a time chart in which the 'saruman' series uses the right-hand Y axis and all others use the left-hand Y axis
sub src(cate, coefficient) {
  emit -limit 100 -hz 10 |
  put category = cate       |
  put value = Math.random() * coefficient
}

(
src -cate "smaug"   -coefficient 10;
src -cate "sauron"  -coefficient 20;
src -cate "saruman" -coefficient 1;
) |
view timechart -o {
  keyField: 'category',
  yScales: {
    secondary: {}
  },
  series: [
  {
    label  : 'smaug',
    color  : 'red',
    name   : 'smaug'
  },
  {
    label  : 'sauron',
    color  : '#228B22',
    name   : 'sauron'
  },
  {
    label  : 'saruman',
    color  : 'burlywood',
    name   : 'saruman',
    yScale : 'secondary'
  }
  ]
}