Zooming on historical data
When a time chart contains historical data only, it also displays a context chart at the bottom that allows you to zoom in on a smaller portion of the chart for closer inspection.
Click and drag across the context chart to select a segment of the chart to zoom in:
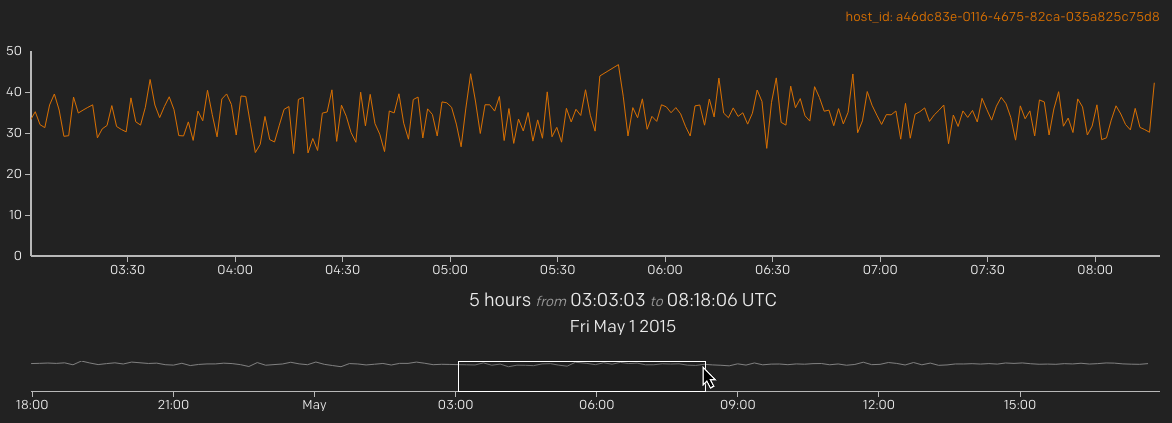 Once you've drawn a rectangle in the context chart, you can drag the
rectangle left or right. Click outside the selected rectangle to reset
the zoom.
Once you've drawn a rectangle in the context chart, you can drag the
rectangle left or right. Click outside the selected rectangle to reset
the zoom.